

Bitcoin generated returns of approximately 148% at the beginning of this year, and this year, it is still the asset that has generated the best returns, compared to other assets such as NASDAQ which generated 34.93% of returns in the same time period. Commodities such as gold, on the other hand, generated returns of 17%.
Reflecting back on the year’s crypto achievements and disappointments, we have seen a great deal of significant developments worldwide with the reveal of Facebook’s Libra, SECs gathering to come up with more detailed regulations on crypto, central banks across the world making their forays into digital currency, China’s change in outlook towards blockchain integration and many more. Mass and institutional adoption of crypto, and exciting crypto projects saw slow progress this year. Others have commented that there are not enough use cases for crypto as they had hoped, while compliance is still an ongoing challenge in the areas of reducing fraud, KYC and AML measures.
So what will Bitcoin’s price trend in 2020? While we are unable to predict the exact trend, we can take a look at the likely possibilities from the graphs below.
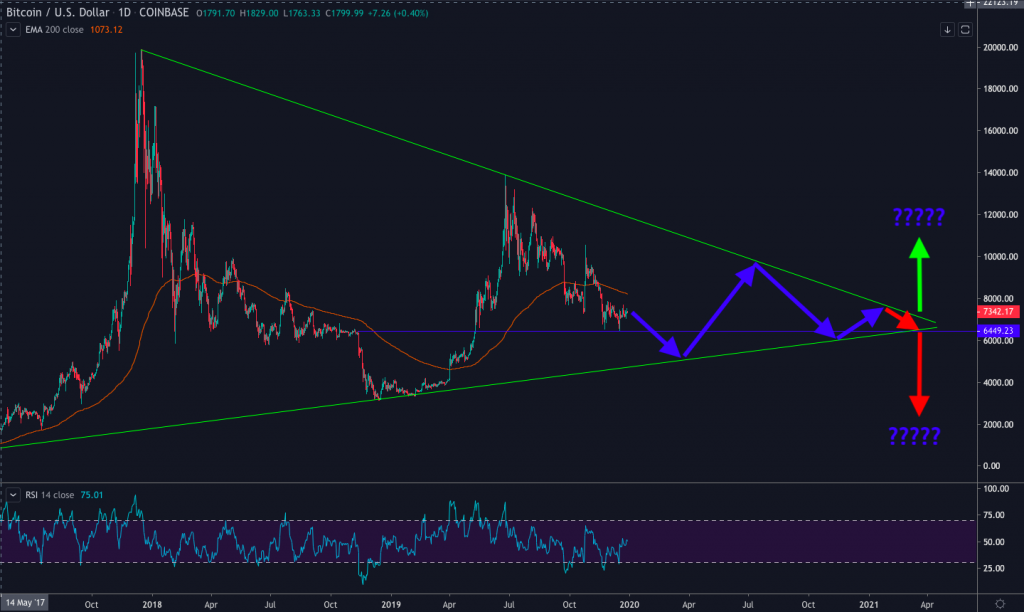
Above: This is the overall look at Bitcoin’s price since 2017 and we can clearly see a sharp spike in gains where the price almost struck $20,000. It dropped sharply between 2018 and 2019, but began to recover midway through 2019 from $3,000. However, despite this recovery, the price was unable to pass the $14,000 level. From the price pattern as indicated in the graph above, we can see that there is a price squeeze, creating a triangle.
Based on this pattern, traders can adjust their medium to long-term investment approach in 2020, continuing into the first quarter of 2021 if the Bitcoin price moves according to the blue arrow above. Based on the Elliott Wave theory, April 2021 will be a crucial period for traders to determine if there will be a significant uptrend for Bitcoin as the third wave can be expected to be the largest uptrend. It could also flip downwards.
According to the triangular price pattern, if the price continues to be compressed in this manner, quick fluctuations in prices can be expected.
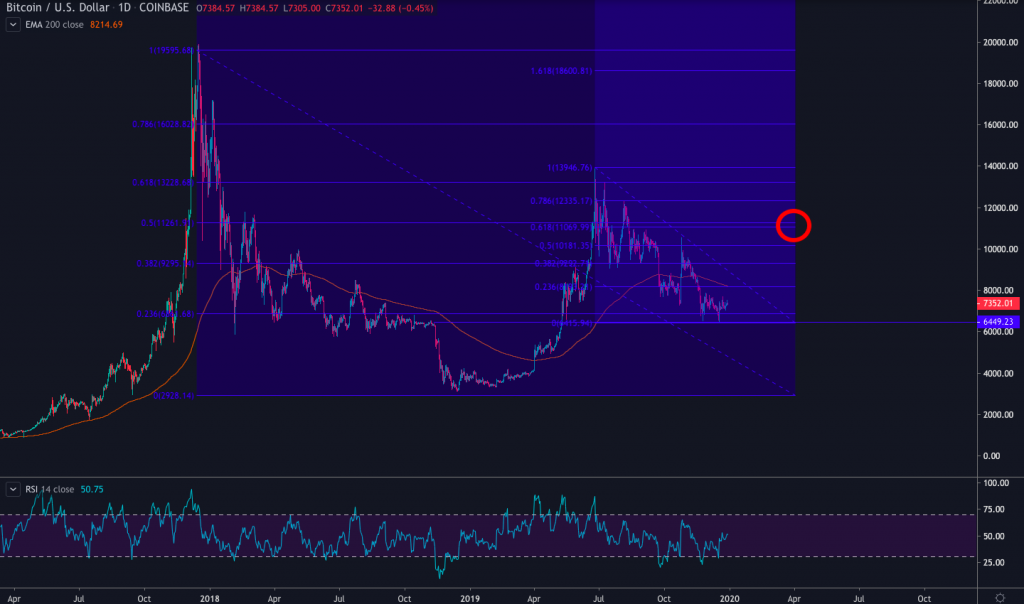
Above: Using tools such as Fibonacci Retracement, we can mark out the highest price point in 2017 to the lowest point in late 2018 at $3,000 and the highest point in 2019 at $14,000 down to the lowest point at $6,500.
From the graph above, there will be a cluster where Fibonacci line strikes $11,000. This is an important resistance level that Bitcoin will have to go through in 2021. The first support level should not drop below $6,500 and the final key support level should be no lower than $5,000.
Note: This article reflects only technical analysis. To get a more accurate picture of how Bitcoin price trends will move in 2020, an in depth analysis into Bitcoin fundamentals is required.